
Institute of Software Technology and Interactive Systems
Information & Software Engineering Group
Music Information Retrieval
PlaySOM - Intuitive access to Music Archives
Subsequent to audio feature extraction the extracted data is used to train a self-organizing map (SOM), in order to create a two-dimensional map of clustered music, the basis for intuitive user interfaces. The PlaySOM and PocketSOMPlayer applications both enable users to browse collections, select tracks, export playlists as well as listen to the selected songs. The PlaySOM presents a full interface, offering different selection models, a range of visualizations, advanced playlist refinement, export to external player devices or simply playback of selected songs. The PocketSOMPlayer, on the other hand, offers a slim version of the desktop application, optimized for the mobile devices.
The PlaySOM main screen
The application for creating Music Maps on Desktop Computers, Laptops and Tablet PCs.
(Clicking on the images shows full size versions.)
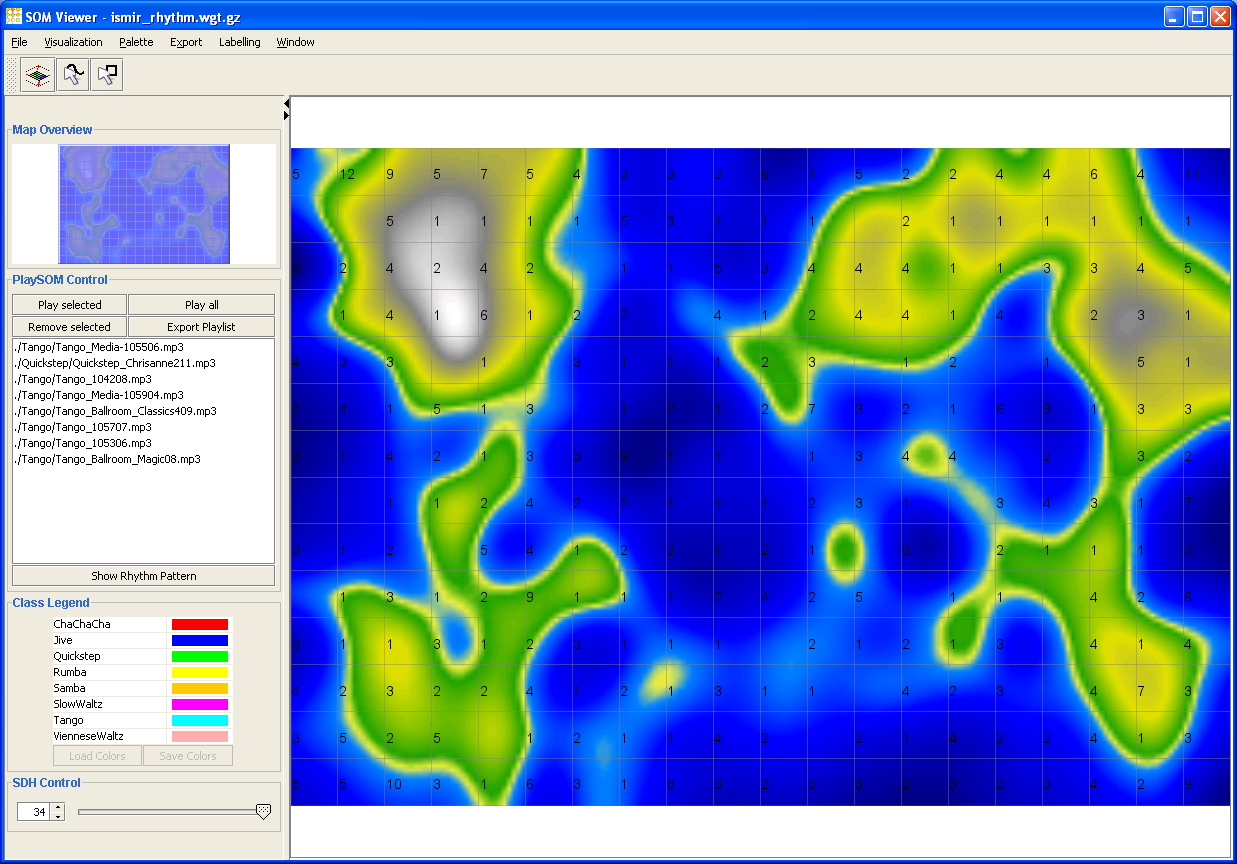
The main screen of the PlaySOM application. The user interface's largest part is covered by the interactive Music Map on the right, where squares represent single units of the Map.
The menu bar provides switching to different visualizations, exporting the map as static images or html files, as well as export to the PocketSOMPlayer format. Visualizations can be switched at any time.
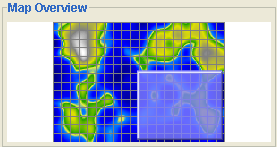 |
The top left of the application provides a small overview of the Music Map, also showing the current part which is zoomed. |
| The toolbar includes buttons for quick zoom out, drawing paths through the Music Map or selecting rectangle areas on the Map. |
Drawing paths - selecting music
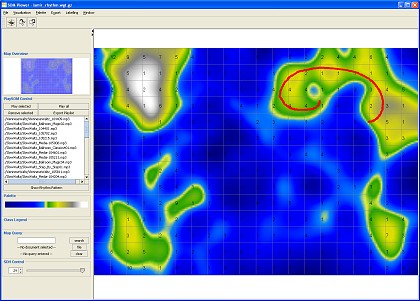
By clicking and dragging the mouse a path drawn on the Map. Paths can be drawn anywhere and are allowed to cross themselves. A playlist is created with titles ordered alongside the path.
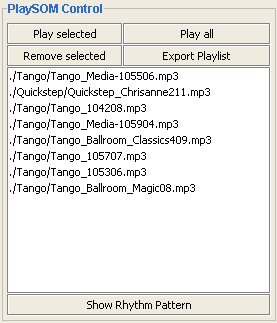 |
Whenever an area is selected on the Map or a path is drawn, the PlaySOM control shows the titles of the current selection or path. This playlist can be refined by removing single items, or it can be immediately played back by pushing the Play all button. Addionally, playlists can be exported, i.e. written to a playlist file. | |
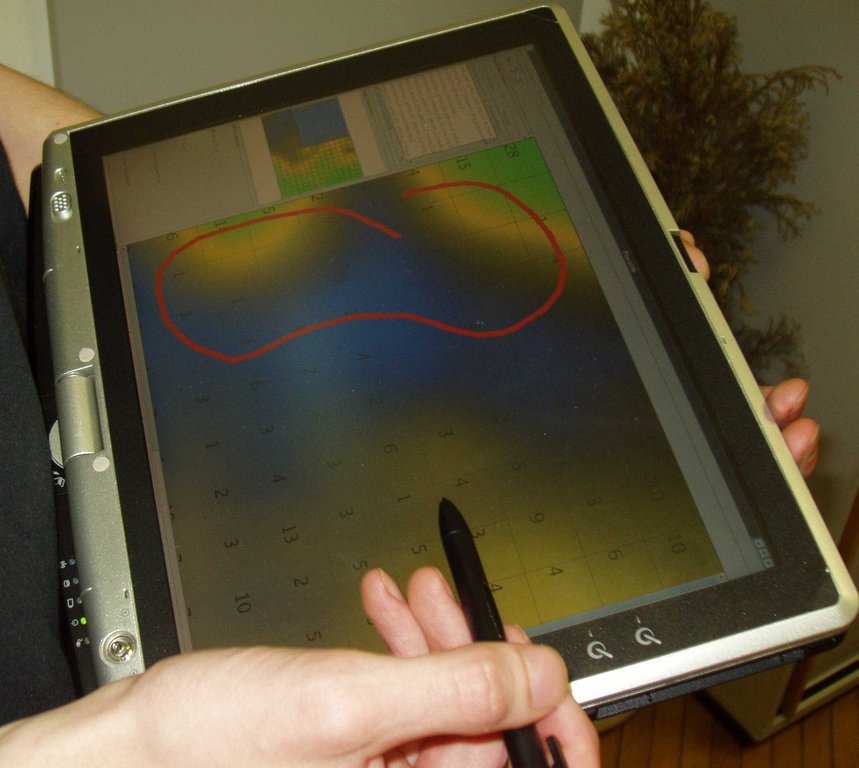 |
Drawing paths is particularly convenient using the PlaySOM application on a touch screen based Tablet PC. Thanks to the portable Java language, the application is installable on any platform running Java. | |
|
The rectangular selection tool allows to drag a rectangle selecting all songs belonging to units inside that rectangle. This model is used to select music from one particular cluster or region on the map. |
Zooming
The Map area of the PlaySOM application can be smoothly zoomed in and out. Additional information is displayed at certain zoom levels.

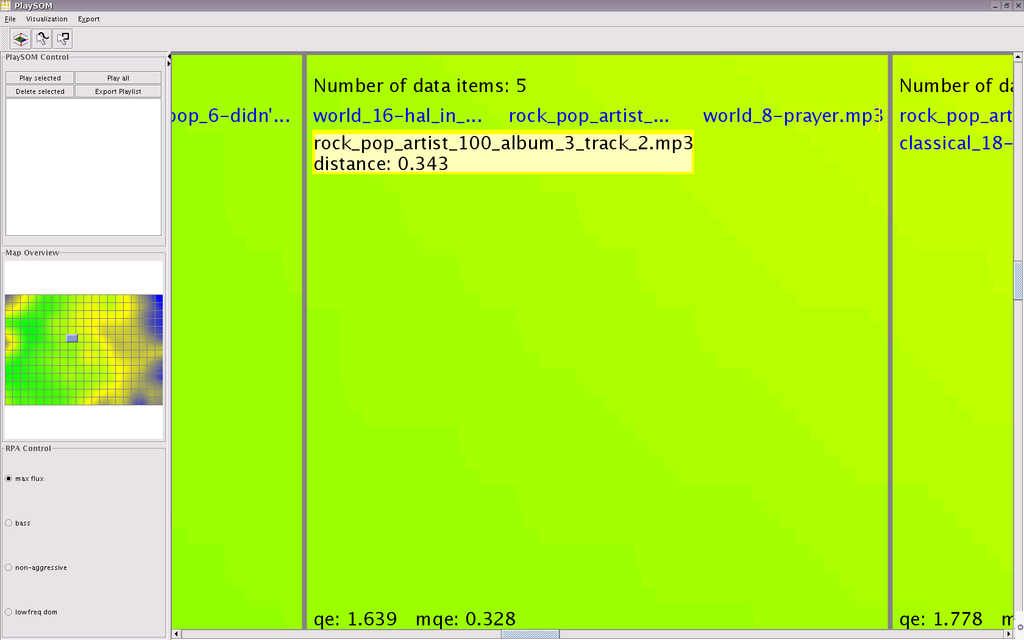
The amount and type of data displayed is influenced by the zooming level, the higher the zooming level, the more information is displayed ranging from information about the number of songs mapped to a particular unit to detailed information about the tracks.
Different Visualizations
|
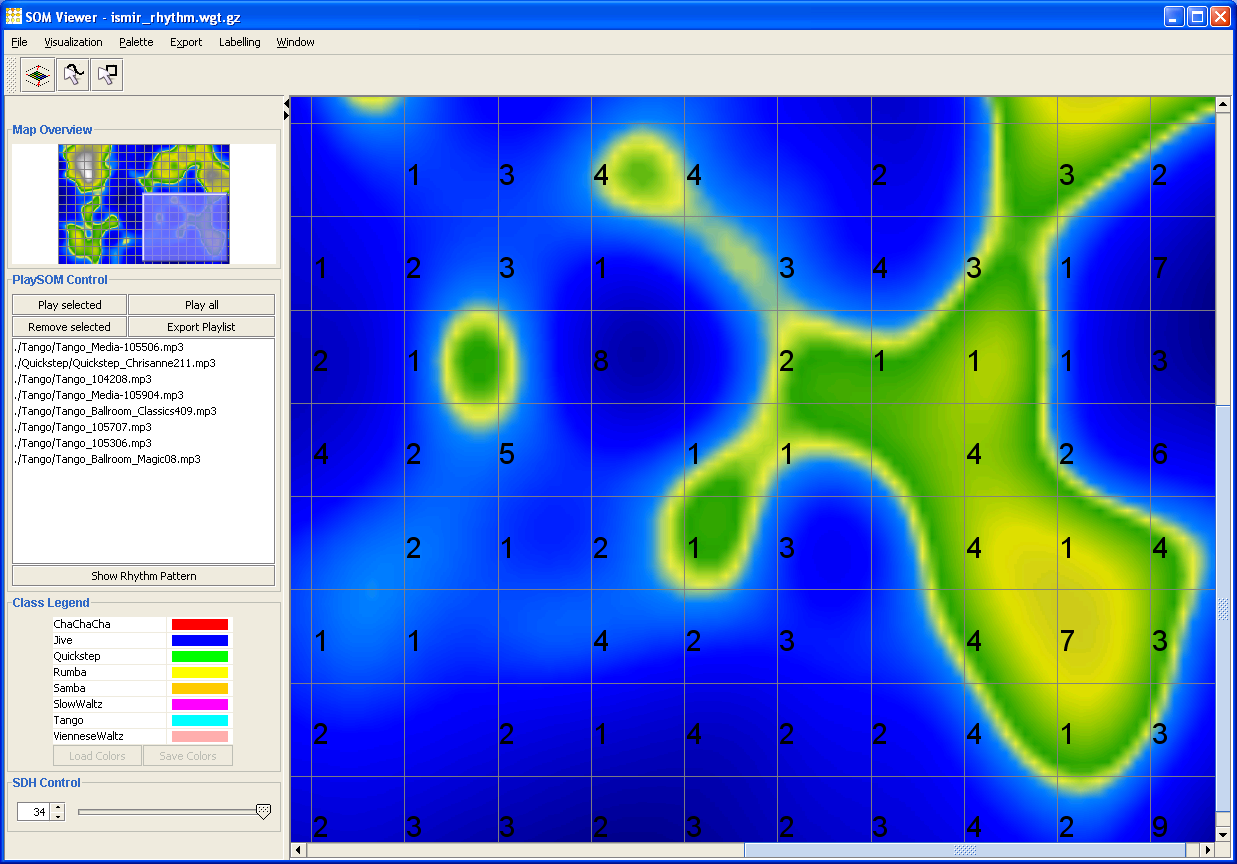
Islands of Music: Probably the most appealing visualization shows clusters of many titles with strong acoustic similarities as islands and areas with few ungrouped titles as the sea between them. | |
|
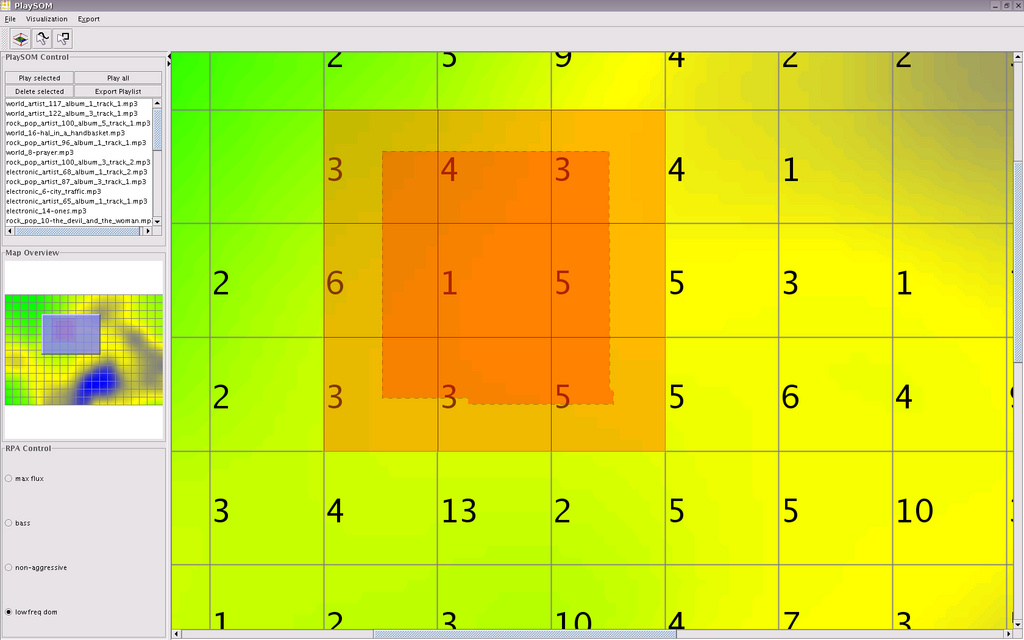
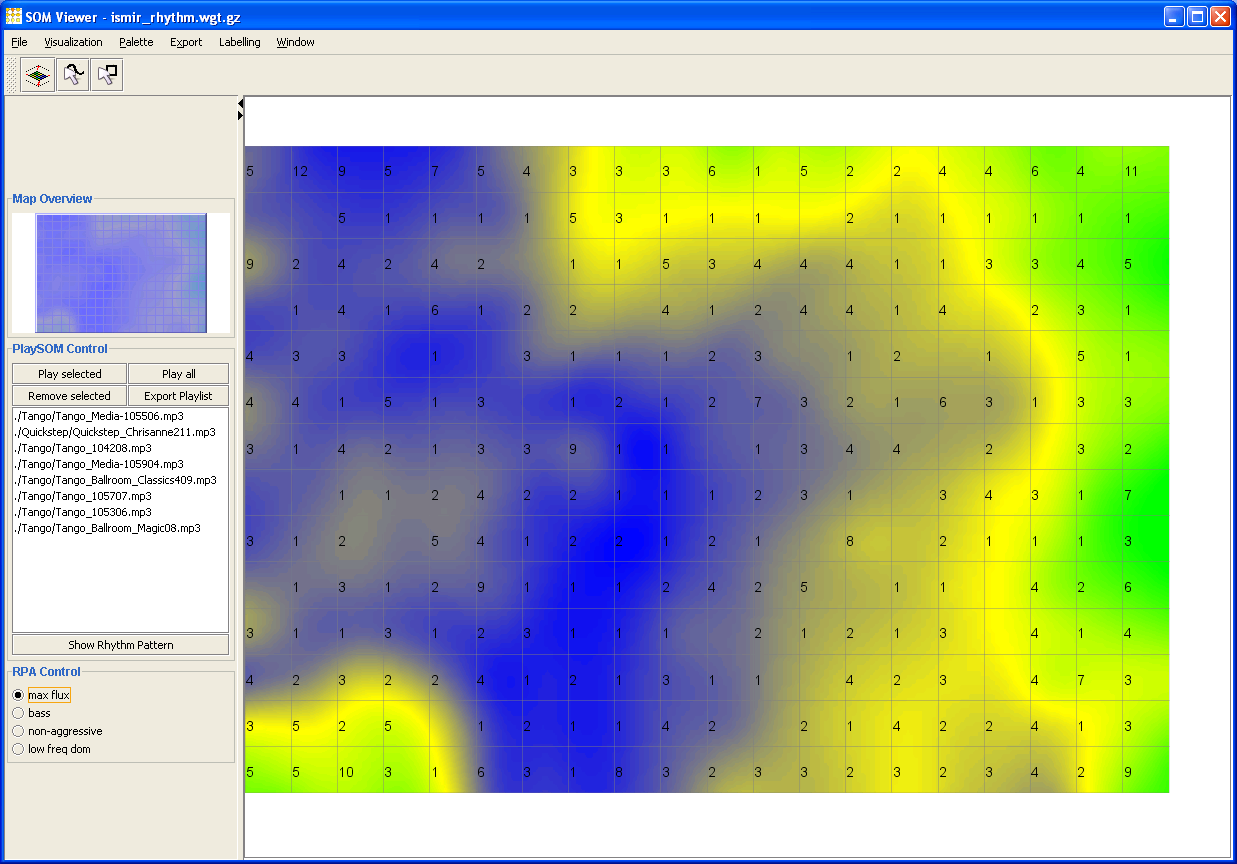
Music properties: These set of visualizations is color-coding acoustic attributes like bass, maximum fluctuations, non-aggressiveness, etc. | |
|
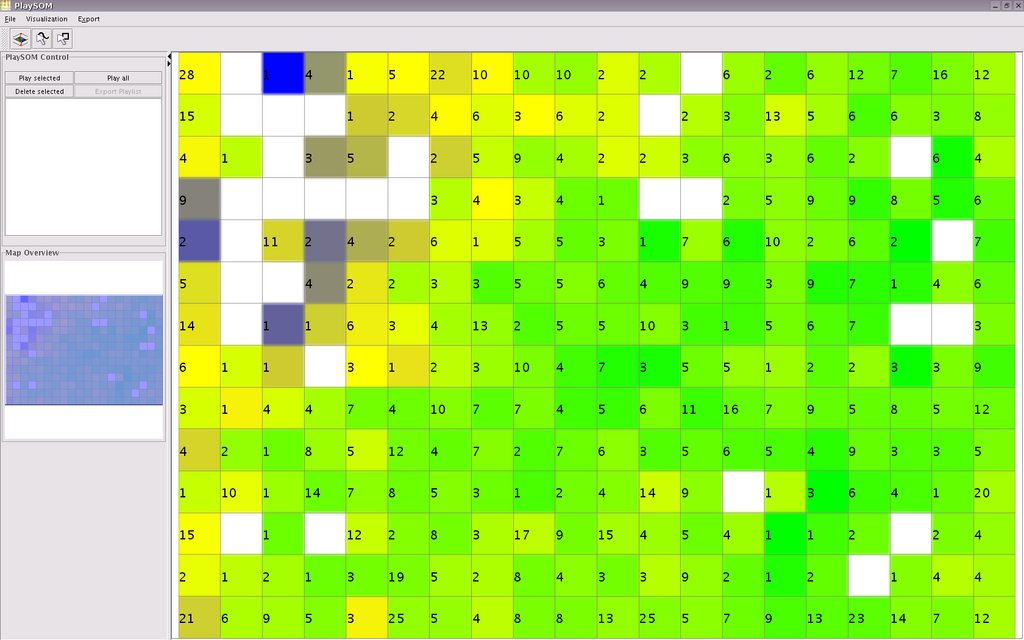
Deviation: mean quantization error of titles mapped to a unit. The darker the color, the higher the variance of songs attached to one particular unit. | |
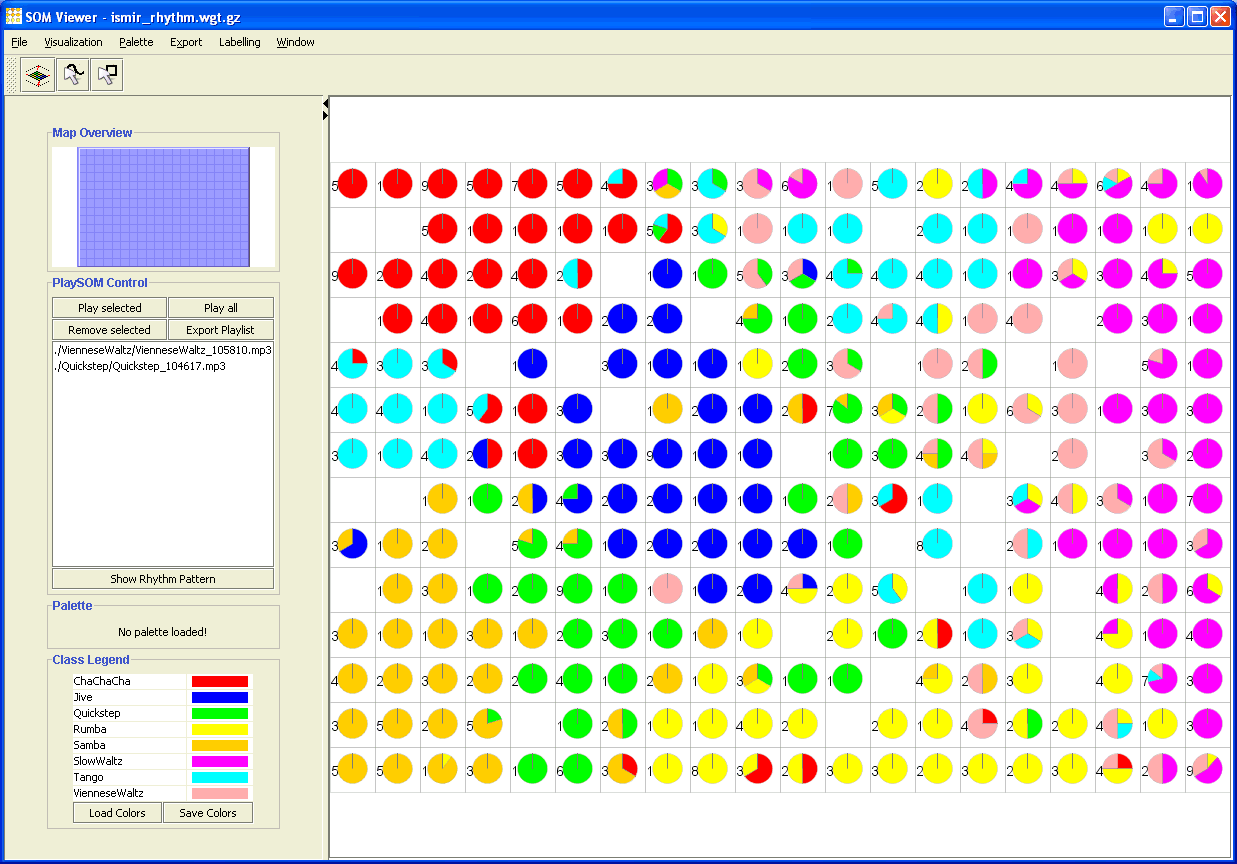 |
Class information: If there is a class label (e.g. the genre attached to a piece of music) available, this visualization color-codes the classes and can thus give an immediate overview of the distribuation of the classes. | |
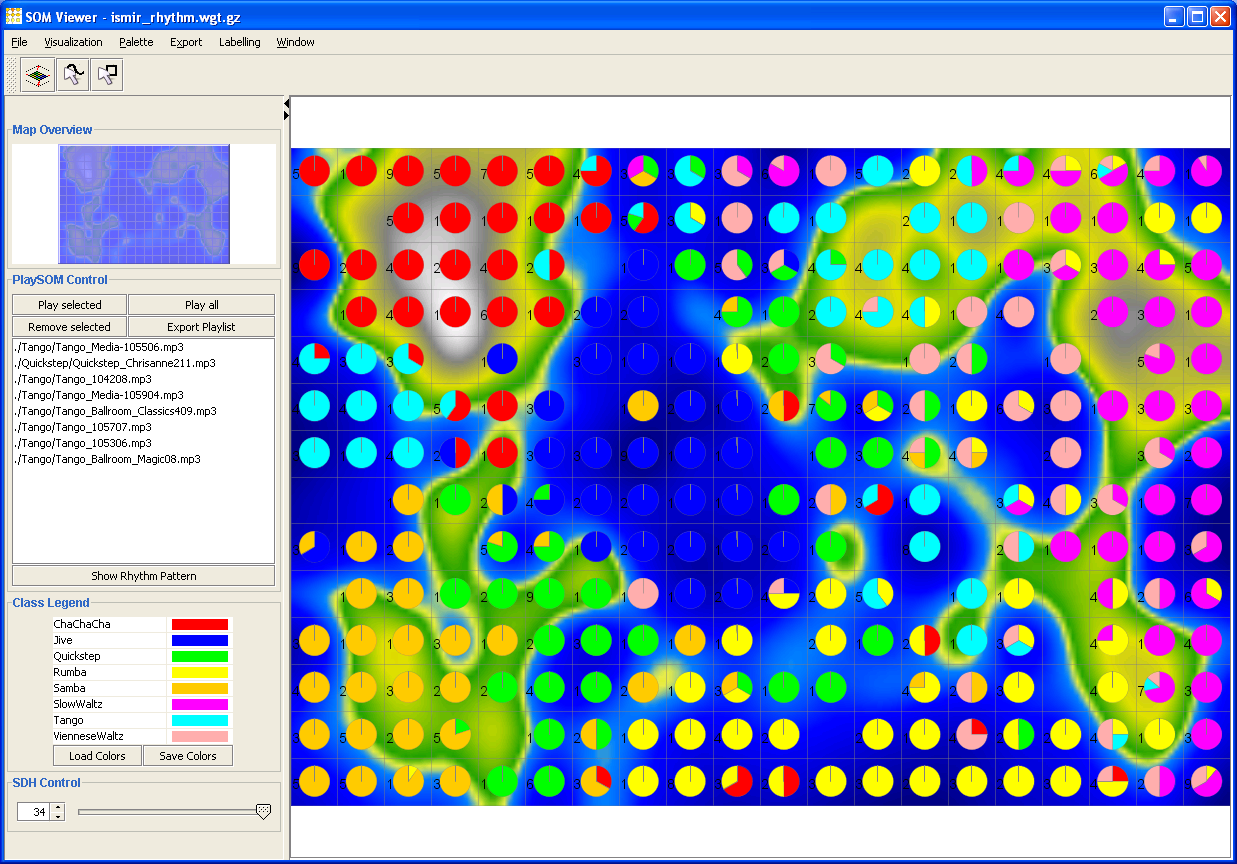 |
Class information visualization can also be combined with other visualizations. |
There is a growing number of additional visualizations available. Also, for each of the visualizations the color representation can be chosen out of a list of color palettes.
The PocketSOMPlayer application offers a lightweight implementation of the features presented here. There is no map overview and no zooming available on the PocketSOMPlayer.
Demos
The following sites contain interactive web-demos of parts of the functionalities of the PlaySOM application:
| top | last edited 06.07.2009 by Jakob Frank |