
Institute of Software Technology and Interactive Systems
Information & Software Engineering Group
Music Information Retrieval
Audio Feature Extraction
Feature Extraction is the core of content-based description of audio files. With feature extraction from audio, a computer is able to recognize the content of a piece of music without the need of annotated labels such as artist, song title or genre. This is the essential basis for information retrieval tasks, such as similarity based searches (query-by-example, query-by-humming, etc.), automatic classification into categories, or automatic organization and clustering of music archives.
Content-based description requires the development of feature extraction techniques that analyze the acoustic characteristics of the signal. Features extracted from the audio signal are intended to describe the stylistic content of the music, e.g. beat, presence of voice, timbre, etc.
We use methods from digital signal processing and consider psycho-acoustic models in order to extract suitable semantic information from music. We developed various feature sets, which are appropriate for different tasks.
Rhythm Patterns
Rhythm Patterns (also called Fluctuation Patterns) describe modulation amplitudes for a range of modulation frequencies on "critical bands" of the human auditory range, i.e. fluctuations (or rhythm) on a number of frequency bands. The feature extraction process for the Rhythm Patterns is composed of two stages:
First, the specific loudness sensation in different frequency bands is computed, by using a Short Time FFT, grouping the resulting frequency bands to psycho-acoustically motivated critical-bands, applying spreading functions to account for masking effects and successive transformation into the decibel, Phon and Sone scales. This results in a power spectrum that reflects human loudness sensation (Sonogram).
In the second step, the spectrum is transformed into a time-invariant representation based on the modulation frequency, which is achieved by applying another discrete Fourier transform, resulting in amplitude modulations of the loudness in individual critical bands. These amplitude modulations have different effects on human hearing sensation depending on their frequency, the most significant of which, referred to as fluctuation strength, is most intense at 4 Hz and decreasing towards 15 Hz. From that data, reoccurring patterns in the individual critical bands, resembling rhythm, are extracted, which – after applying Gaussian smoothing to diminish small variations – result in a time-invariant, comparable representation of the rhythmic patterns in the individual critical bands.
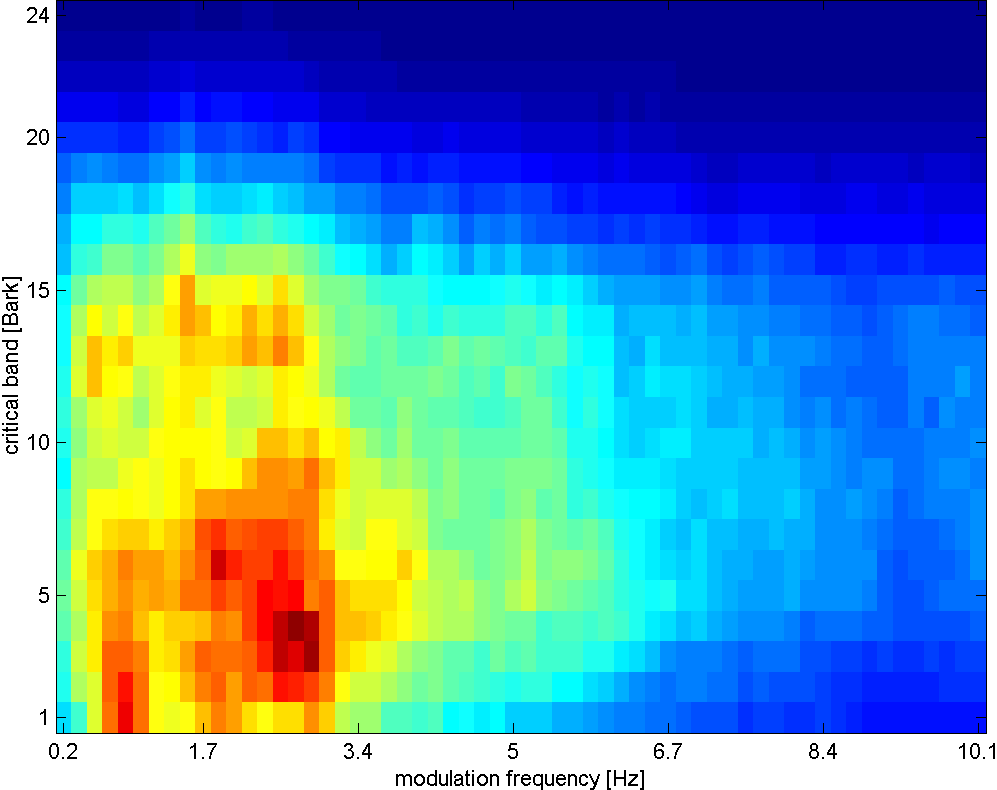 classical music
|
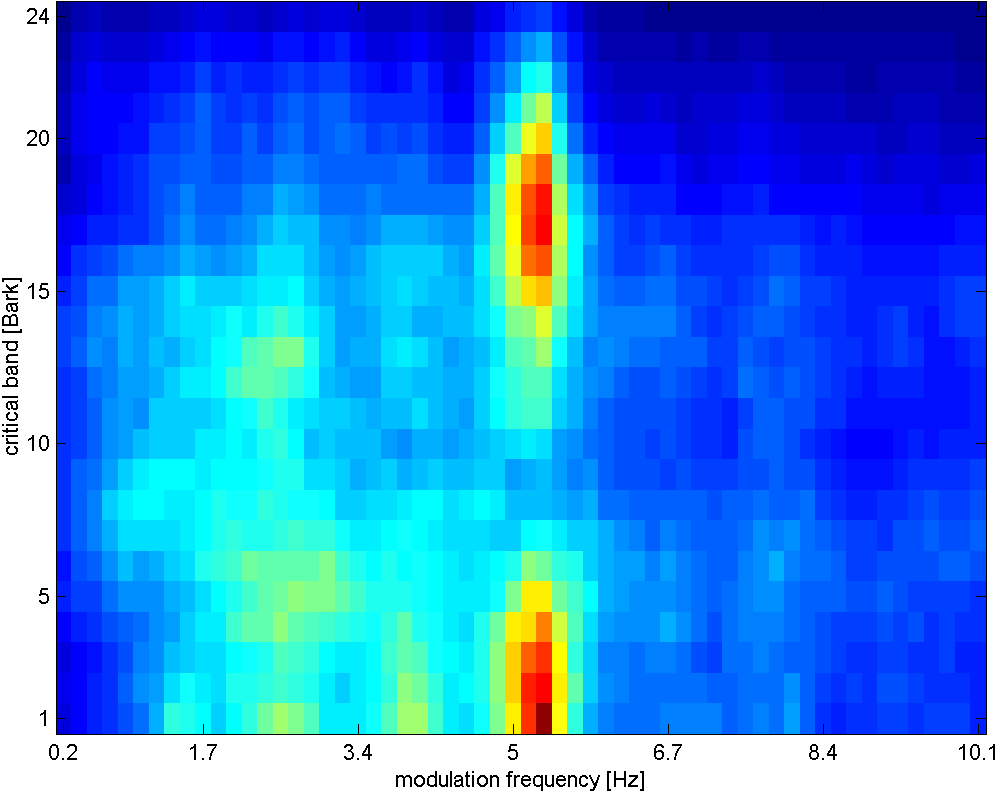 rock music
|
Rhythm Patterns

Block diagram of audio feature extraction
Statistical Spectrum Descriptor
The Sonogram is calculated as in the first part of the Rhythm Patterns calculation. According to the occurrence of beats or other rhythmic variation of energy on a specific critical band, statistical measures are able to describe the audio content. Our goal is to describe the rhythmic content of a piece of audio by computing the following statistical moments on the Sonogram values of each of the critical bands:
- mean, median, variance, skewness, kurtosis, min- and max-value
Rhythm Histogram
The Rhythm Histogram features we use are a descriptor for general rhythmics in an audio document. Contrary to the Rhythm Patterns and the Statistical Spectrum Descriptor, information is not stored per critical band. Rather, the magnitudes of each modulation frequency bin of all critical bands are summed up, to form a histogram of "rhythmic energy" per modulation frequency. The histogram contains 60 bins which reflect modulation frequency between 0 and 10 Hz. For a given piece of audio, the Rhythm Histogram feature set is calculated by taking the median of the histograms of every 6 second segment processed.
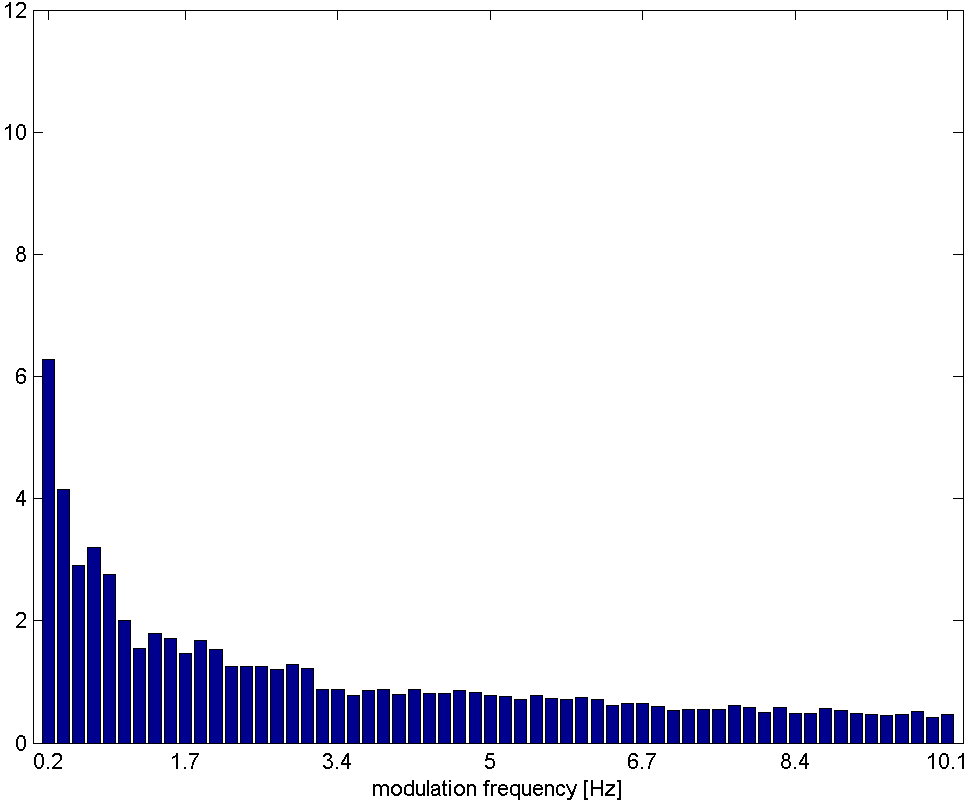 classical music
|
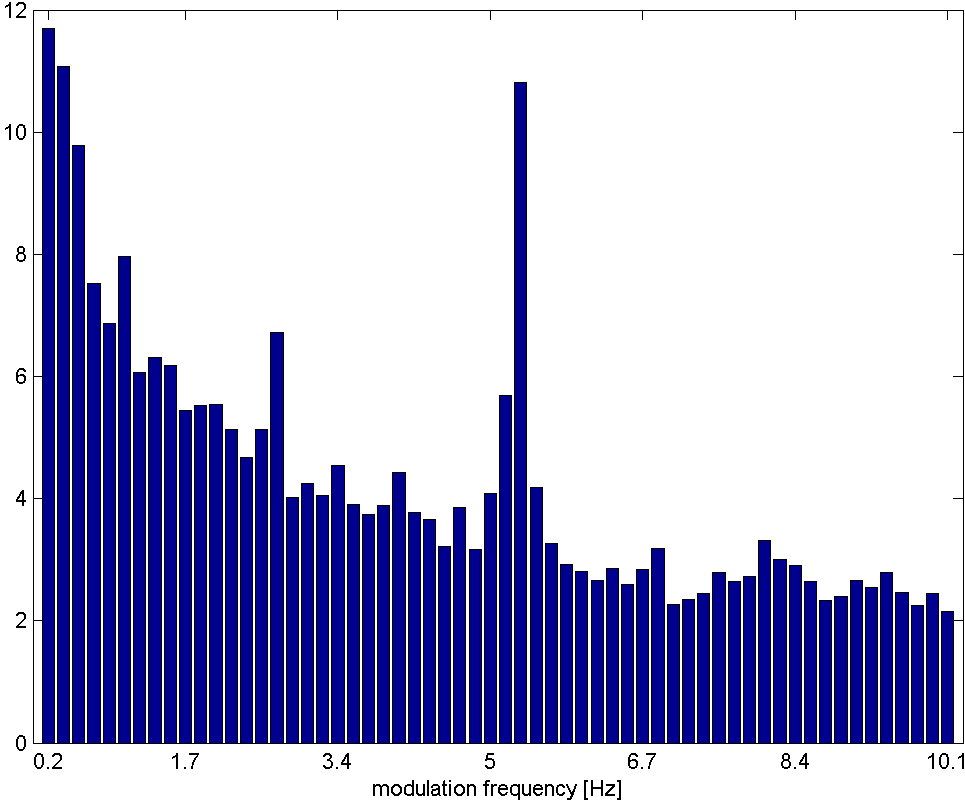 rock music
|
Rhythm Histograms
Modulation Frequency Variance Descriptor
This descriptor measures variations over the critical frequency bands for a specific modulation frequency (derived from a rhythm pattern).
Considering a rhythm pattern, i.e. a matrix representing the amplitudes of 60 modulation
frequencies on 24 critical bands, an MVD vector is derived by computing statistical measures (mean, median, variance, skewness,
kurtosis, min and max) for each modulation frequency over the 24 bands. A vector is computed for each of the 60 modulation
frequencies. Then, an MVD descriptor for an audio file is computed by the mean of multiple MVDs from the audio file's segments,
leading to a 420-dimensional vector.
Temporal Statistical Spectrum Descriptor
Feature sets are frequently computed on a per segment basis and do not incorporate time series aspects. As a consequence, TSSD features describe variations over time by including a temporal dimension. Statistical measures (mean, median, variance, skewness, kurtosis, min and max) are computed over the individual statistical spec- trum descriptors extracted from segments at different time positions within a piece of audio. This captures timbral variations and changes over time in the audio spectrum, for all the critical Bark-bands. Thus, a change of rhythmic, instruments, voices, etc. over time is reflected by this feature set. The dimension is 7 times the dimension of an SSD (i.e. 1176).
Temporal Rhythm Histograms
Statistical measures (mean, median, variance, skewness, kurtosis, min and max) are computed over the individual Rhythm Histograms extracted from various segments in a piece of audio. Thus, change and variation of rhythmic aspects in time are captured by this descriptor.
- Thomas Lidy, Andreas Rauber.Evaluation of Feature Extractors and Psycho-acoustic Transformations for Music Genre Classification. Proceedings of the Sixth International Conference on Music Information Retrieval (ISMIR 2005), pp. 34-41, London, UK, September 11-15, 2005. PDF, BibTeX
- A. Rauber, E. Pampalk, D. Merkl: The SOM-enhanced JukeBox: Organization and Visualization of Music Collections based on Perceptual Models. In: Journal of New Music Research (JNMR), 32(2):193-210, Swets and Zeitlinger, June 2003. Abstract, BibTeX
- A. Rauber, and M. Frühwirth: Automatically Analyzing and Organizing Music Archives. In: Proceedings of the 5. European Conference on Research and Advanced Technology for Digital Libraries (ECDL 2001), Sept. 4-8 2001, Darmstadt, Germany, Springer Lecture Notes in Computer Science, Springer, 2001. Abstract, HTML, PDF, BibTeX
Download:
Software for the extraction of Rhythm Patterns, Statistical Spectrum Descriptors, Rhythm Histograms, Modulation Frequency Variance Descriptor, Temporal Statistical Spectrum Descriptors and Temporal Rhythm Histograms is available from the download section.
| top |
last edited 22.01.2007 by Thomas Lidy
|