The metaViewer
Motivation
Most of today's search engines still provide search results as a list of textual entries. The available information on the internet is increasing rapidly. A growing number of result sets for a given search text can soon become unwieldy. Using some sort of visualization could help the user analyzing the returned results. To make information visible contained in the metadata of results, graphical metaphors can be used for visualization. For this purpose one icon of a well known object is used to represent each search result. The appearance of the icon is controlled by the metadata contained in the result. This kind of representation is one way of making structural information visible and easier to compare and evaluate.
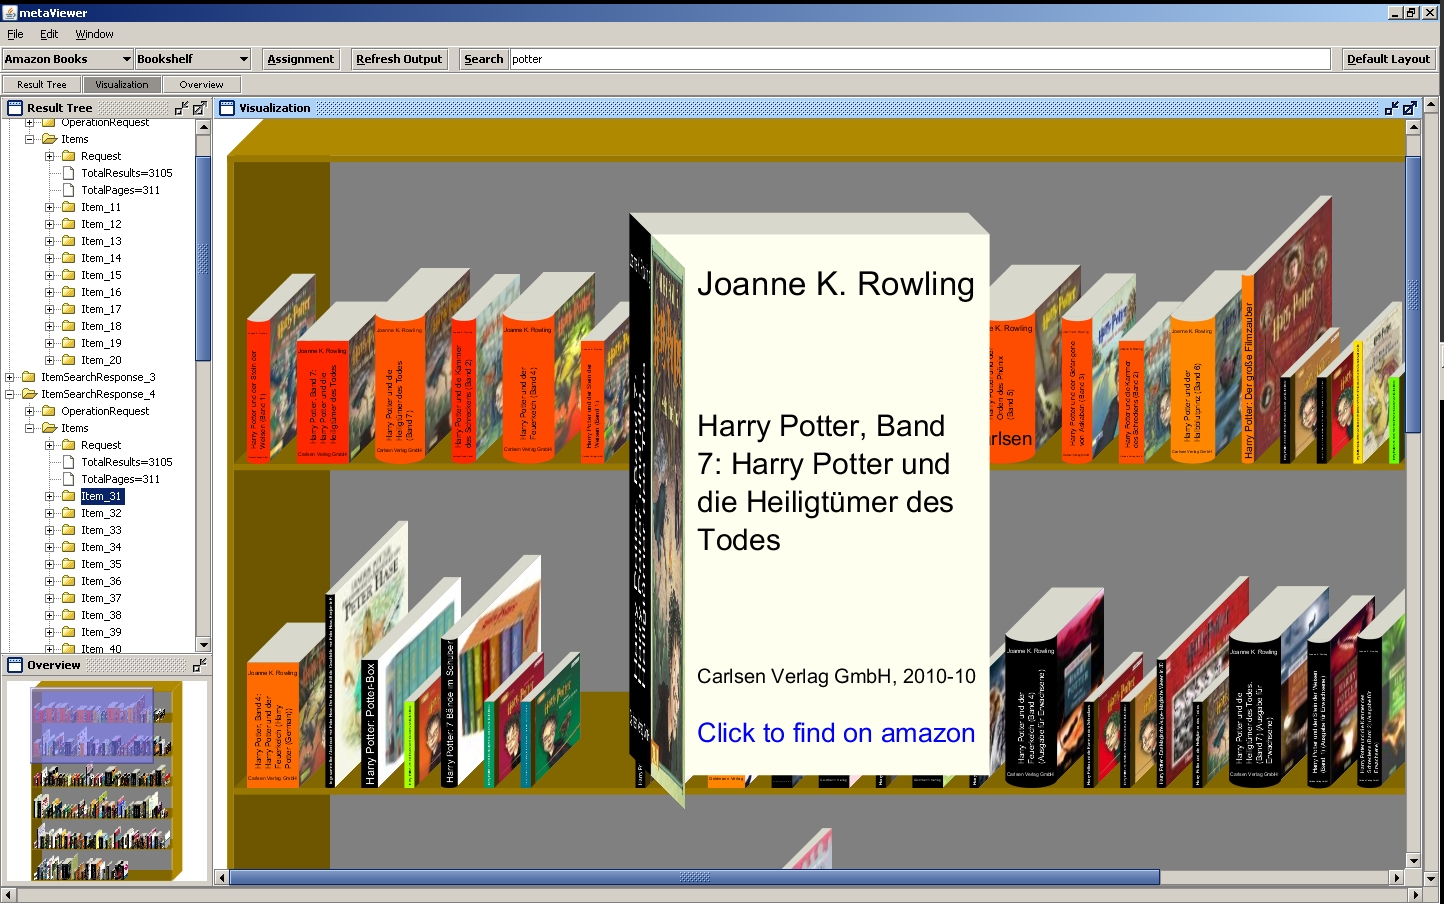
Visualizing search results retrieved from an online book store using a book metaphor
Finding an appropriate visualization can be a rather challenging task as there are many possible metaphors. Previous publications concentrate on querying a specific data source and try to visualize it using a single graphical metaphor. As an example the libViewer, developed some time ago also at ifs, uses visualizations of books to represent search results mainly got from online libraries. We wanted to find an easy way to speed up the process of finding suitable metaphors by developing an application that provides a set of alternative visualizations. The challenge was to identify qualities that metadata of all data sources have in common and to find general properties for describing those metaphors. This should be the way to loosen the tight connection between metadata and graphical metaphors.
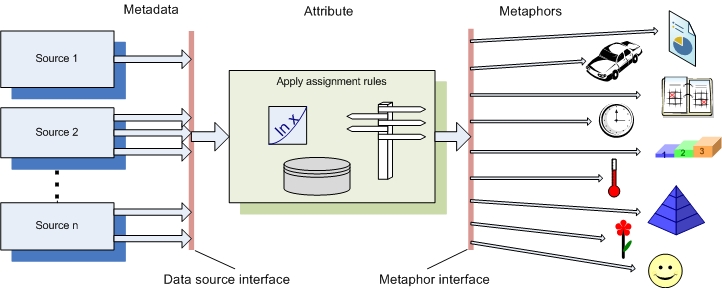
With the metaViewer source data and visualization can be treated seperately
The metaViewer presented here shows a new approach to finding the right metaphor in an easy manner. It allows the assignment of metadata fields to properties of the chosen metaphor. The metaViewer can be used for all kinds of different data sources. For visualization some graphical metaphors are ready to use and new ones can easily be defined.
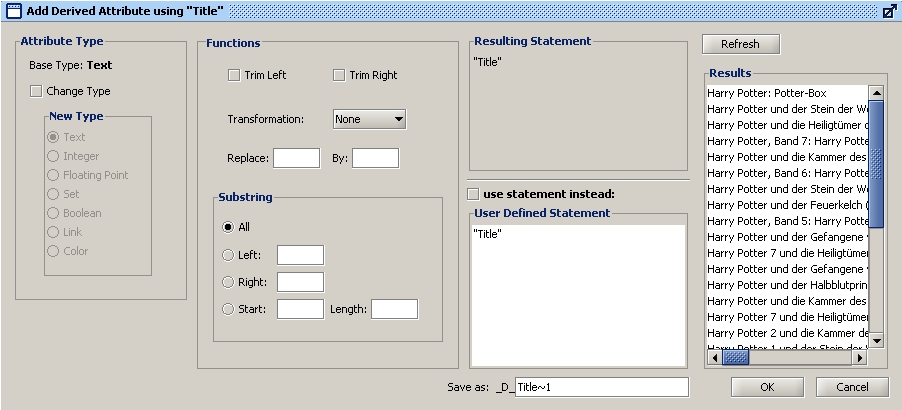
Data fields in search results can be edited and defined as attributes before used
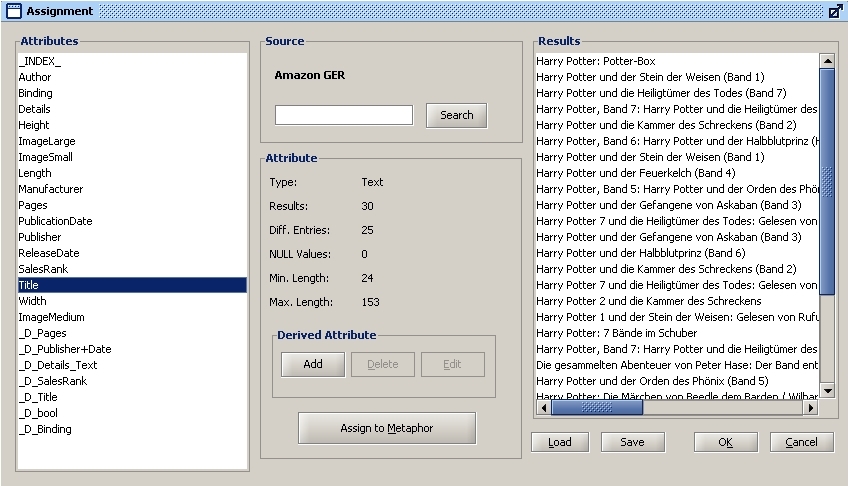
Attributes can be assigned to metaphor properties
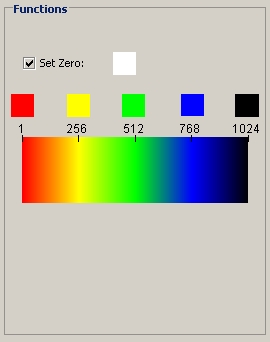
Attributes can control e.g. colors in metaphors by defining a color gradient |
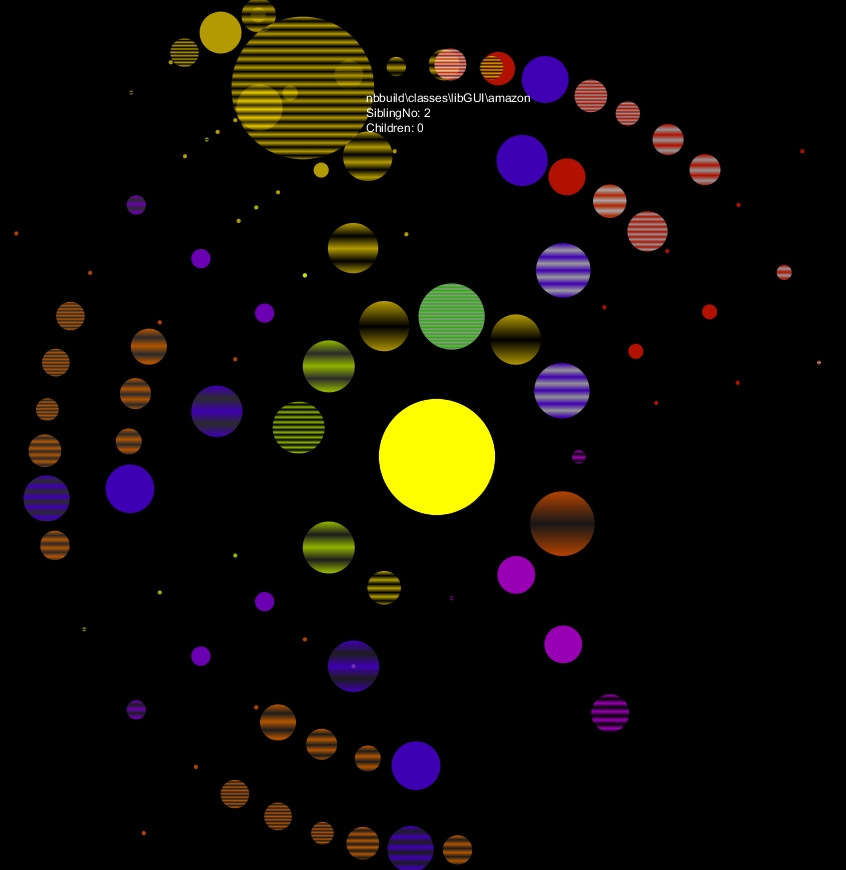
Using planets arranged in a solar system to visualize folders in a directory structure |