Multi-challenge Data Set
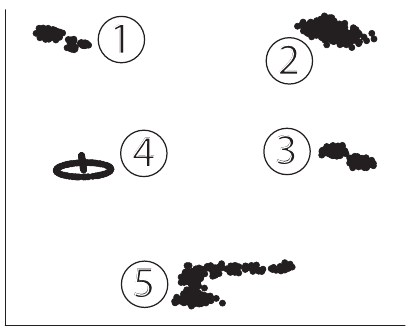
The Multi-challenge data set is used to demonstrate how a data analysis method deals with clusters of different densities and shapes when these different characteristics are present in the same data set. This data set consists of several sub-data sets that are placed in a 10-dimensional space. The subsets themselves may live in spaces of lower dimensions. A PCA projection of this data set is shown below.

Each subset consists of the same number of sample points, and can be described (in the order of their numeric label) as follows:
- The first subset consists of a Gaussian cluster and another cluster that is itself divided into three Gaussian clusters, all of them living in a three-dimensional space. This subset is used to demonstrate how an algorithm deals with different levels of granularity in cluster structures. The distance between the centers of the two main clusters, i.e. the the big cluster and the cluster that consists of the three smaller ones, is 5 times the standard deviation d of the first main cluster. The three smaller clusters are arranged around the center of the second cluster, which they themselves form, on a circle of radius 5-d equidistant from each other. The three 3 small cluster centers and the center of the large cluster lie in the same plane. The small clusters each have a standard deviation of d and one third of the number of 3 data points of the large cluster.
- The second subset is a three-dimensional data set that consists of two overlapping Gaussian clusters. The distribution of points into these clusters is skewed: While the clusters both share the same covariance matrix and thus the same density, the first cluster has twice the amount of points than the second one. The point of introducing this data set is to test how a data analysis method copes with clusters with different numbers of data samples. The distance between the centers is 3 times the standard deviation of the clusters.
- The third subset is a 10-dimensional set of two well-separated Gaussian clusters with the same covariance matrix. It is used to contrast higher- with lower-dimensional structures, as the other four subsets are of lower dimensionality. The distance between the clusters is again 3 times their standard deviation. The fourth subset is a classic intertwined rings data set. It lives in a three-dimensional data space. This data set is used for showing how a method deals with non-intersecting structures that cannot be separated in a linear way. The rings are circles that run through each others centers. The planes on which they are located are orthogonal to each other. The data points are sampled from these rings with no additional noise.
- The fifth subset is sampled along a curve that consists of 4 short lines that are patched together at the endpoints. The data points are arranged along this curve with a level of noise that increases close to the end of the curve. This subset lives in a four-dimensional space. It is introduced in order to show how data analysis methods cope with piecewise linear structures that extend to multiple dimensions. In detail, the four parts of this subset are line segments each parallel to one of the axis. The data points are sampled from this structure with a small amount of 1 Gaussian noise with standard deviation of 20 of the length of the line segments.
The subsets are normalized individually to zero mean and unit variance. They are then arranged on a plane, which can be seen in Figure D.2.3. The distance between the data sets is 10 times their standard deviation.
Downloads:

